ASSETS
Nieuws en bijeenkomsten die je slimmer maken.
Tractor, sensor & machine data
De toepassing van precisielandbouw in de bedrijfsvoering, gaat vrijwel altijd gepaard met het werken met data. Deze data kan afkomstig zijn van sensoren, maar ook vanuit de trekker of machine. Alle data moeten uiteindelijk ergens verzameld worden. Er zijn meerdere platforms, apps en leveranciers die dit aanbieden. Hieronder zijn er een aantal van de platforms en apps te vinden, die de VDBorne Campus tot zijn beschikking heeft.
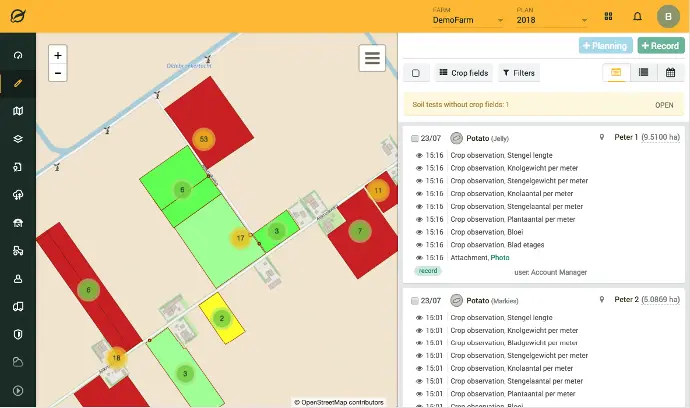
Cloudfarm - Dacom
With Dacom's Cloudfarm (mobile) app, collected data from sensors, drones, satellites and machinery can be collected from the farm's plots. This can be used to visualise the variation in a plot, using a task map. Cloudfarm gives the option to easily create a task map, for different cultivation measures. From the crop records that can be maintained via Dacom, the schedule can then be sent wirelessly to the tractor/tractor terminal and the task can be executed on the plot.
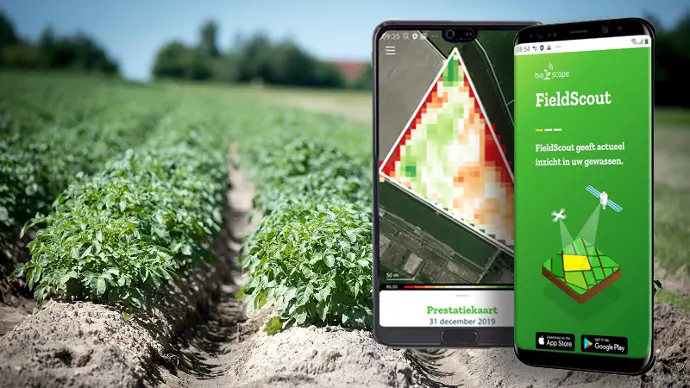
Fieldscout - Bioscope
With Bioscope's FieldScout app, arable crops can be monitored by collecting data using satellite imagery. With the collected data, maps are created, which can be used to visualise the variation of a particular plot during the growing season of the crop. In addition, the collected data is available for online cultivation software, such as Dacom. The following maps can be displayed in the app. Soil zone map, which can be used to visualise the structure of the soil, which in turn can be a measure of soil potential.
- Biomass map of the plot, this can be used to visualise the growth of the crop on the plot. Variations in growth can then also be visualised on the plot.
- By-growth map, this map shows the amount of biomass what has grown. This allows the rate of growth to be visualised, thus identifying which parts of the plot have lagging growth.
- By-growth map, this map shows the amount of biomass what has grown. This allows the rate of growth to be visualised, thus identifying which parts of the plot have lagging growth.
- Scouting map, this map shows the deviations (faster or slower) from average growth in the plot.
Using the different maps, it is possible to create a task map. This makes it possible, for example, to apply variable additional fertilisation or variable haulm destruction. Other cultivation measures may also be possible with task maps.
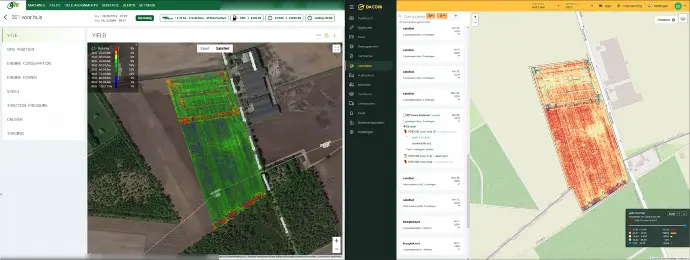
AVR Connect
With AVR Connect, the AVR Puma self-propelled sprayers can be linked to an app. In it, all machine data from a plot can be placed, which comes from the sensors attached to the AVR Puma. The sensor data is collected by the AVR Puma and then sent wirelessly in real time to the AVR Connect platform. An example of data collected in the app is yield measurement, which allows yields to be mapped across the entire plot. Based on this information, it is possible to take cultivation measures the following year, improving weak spots in the plot, for example. In addition, the app offers more data and possibilities, which can help the grower optimise cultivation or lead to lower costs in cultivation. It is possible to transfer collected data from the AVR connect to other platforms, such as Dacom, for example.
Interreg-project ADaM & PreciLa
Theme: A smarter Europe
Duration: 01.04.2023 - 31.03.2026
Flemish and Dutch agriculture faces various challenges, including decreasing profitability, growing farm sizes, and significant environmental pressure. Additionally, there is an international data revolution towards smarter agriculture, where data is generated through sensors in the soil, on the crops, on drones, etc. This data is then processed with algorithms and is exchangeable via Application Programming Interfaces (APIs) and Internet of Things (IoT) applications. The possibilities are enormous but are still not fully utilized.
Investing in precision agriculture for sustainable and efficient production
ADaM & PreciLa aims to bring Precision Agriculture (PreciLa) to the grower in Flanders and the Netherlands thanks to improved Agri-DataManagement (ADaM), technical innovations and practical demonstrations. Various applications such as variable fertilisation and growth control, smart irrigation and variable sowing and planting will be tested for generating and translating raw data into practical advice so that there is better insight into the costs and benefits of precision agriculture. For instance, collected data from soil moisture sensors and soil scans, drone and satellite images will allow separately controllable irrigation blocks to be installed to achieve smart irrigation. To manage the data generated from the various precision techniques, the project aims at optimally connected data platforms. This way, the grower and his advisor have all information in one place and can compare and combine information from different sources to create task maps for variable crop measures. Finally, growers should have a clear understanding of the investment costs versus the potential increased yield. An economic and technical evaluation of the technologies seeks to provide insight into this.
Partners